Monitored Natural Attenuation (MNA) is a remediation method that relies on natural processes to decrease contamination in the soil or groundwater. It is a popular method of remediation since it tends to involve less equipment and labor and therefore, less cleanup costs.
Scientists typically monitor the contamination at a site to ensure that it is attenuating properly and within a reasonable time period. According to New Jersey’s MNA guidance, the applicability of MNA must be demonstrated by lines of evidence directly or indirectly indicate that natural attenuation processes are occurring. With TS-CHEM, it is simple to establish a clear line of evidence that demonstrates natural attenuation is occurring at your site.
This blog post will cover the second Example Application in the TS-CHEM Example Application series: Natural Source Flushing with MNA. To follow along and review the model files, you can download this example application HERE.
Overview
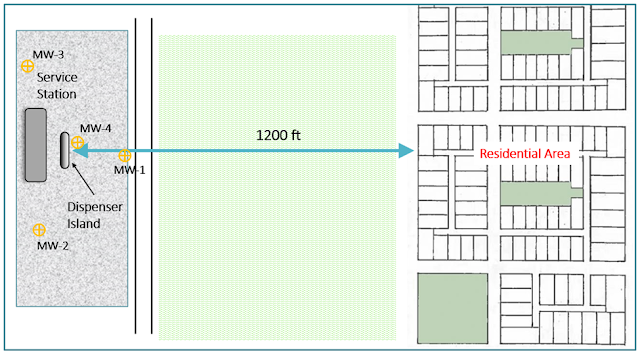
In this scenario, there has been a gasoline release from the dispenser island at a service station. While the leak is repaired shortly after the release, regulators and residents are worried about the release of benzene to the ground considering a residential development is located 1,200 feet to the east where shallow domestic wells are located. An initial on-site investigation reveals the following information:
• Aquifer material = medium sand; some gravel; little silt
• Hydraulic gradient to the east = 0.003 ft/ft
• Source area (MW-4) benzene concentration = 3,000 ug/L
 |
| Figure 1. Site map showing the distance from the benzene source at the dispenser island to the residential area. |
Concerned by cleanup costs, the responsible party would prefer to remediate the contaminated area using MNA if possible. For MNA to be applicable, the responsible party needs to demonstrate that benzene is being flushed away sufficiently so as not to impact the domestic wells 1,200 feet away. For this example project, the benzene plume boundary is set to 5 ug/L since the USEPA drinking water standard for benzene is 5 ug/L.
Setting Up the Model
Since the leak from the dispenser island has been repaired, there is no constant source of contamination. Because of this, BIOSCREEN-AT is a good model solution for this analysis because its vertical patch source (in a semi-infinite aquifer bounded at the water table) represents an exponentially decaying source concentration. This model solution will allow you to see changes in maximum plume extent from an early phase of growth, and then through subsequent plume decrease as the sources flushes away. In TS-CHEM, the following model parameters should be set:
• Hydraulic gradient = 0.003 ft/t
• Hydraulic conductivity = 60 ft/d
• Effective porosity = 0.25
• Source width = 10 ft
• Source depth = 2 ft
• Initial Benzene source concentration = 3,000 ug/L
• Initial estimate of source flushing half life = 4 years
Analysis 1: Examining Source Decrease Through Flushing
First, model observation points should be set downgradient from the dispenser at 100 ft (MW-1), 600 ft (mid-way to the neighborhood), and 1000 ft (approaching the neighborhood).
 |
| Figure 2. Site map showing model observation points located in between the dispenser island and the residential area. |
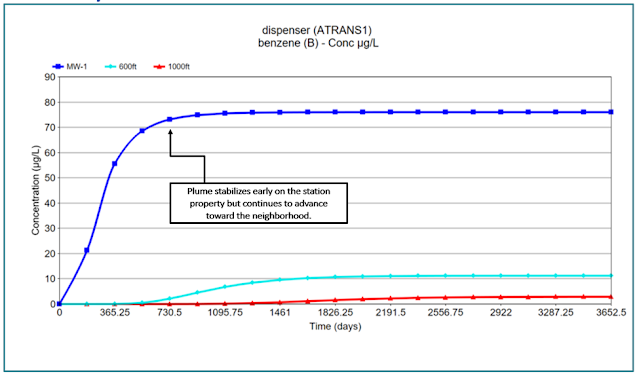
These observation points should give insight into the levels of benzene at these locations over time and whether the benzene plume is decaying at a sufficient rate. After running the model for ten years, the C v t plots reveal that the plume reaches a peak around 1.5 years on the station property but continues to advance towards the neighborhood. The observation points located farther downgradient from the source show the arrival and growth (increasing concentrations) of the plume until the reduction of the source causes concentrations to decline in these areas.
 |
| Figure 3. The C v t chart in TS-CHEM displaying benzene concentrations near the source at MW-1 (dark blue), 600 ft from the source (aqua), and 1000 ft from the source (red). |
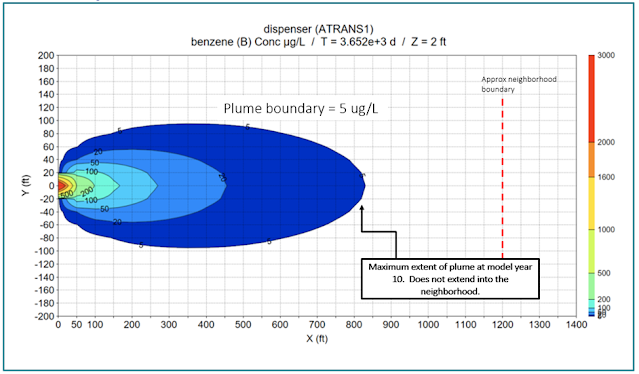
The contour plot shows that the plume reaches its maximum extent of about 875 feet after 7 years and does not extend into the residential development. The calculated plume at the 7-year time point encompasses an area of 88,350 ft
2.
 |
| Figure 4. TS-CHEM's contour chart indicates that the maximum plume extent (bound at 5 ug/L) does not reach the residential area. |
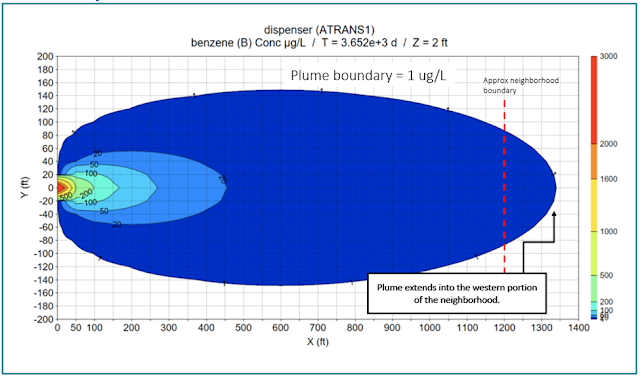
The contour plot set to year 10 shows that the extent of the benzene plume shrinks by about 150 feet. The plume will continue to shrink slowly over many years until it decreases below the 5 ug/L standard. Due to this slow rate of decay, a decision may be made to either move to evaluating an active remedy scenario in which the source is removed, or possibly to evaluate a scenario with a more rapid rate of source depletion. That source depletion Analysis 2 is presented below.
 |
| Figure 5. TS-CHEM's contour chart showing a reduction in plume extent from year 7 to year 10. |
Analysis 2: Examining a Higher Source Degradation Rate
Let’s say that the responsible party continues to investigate the source area of the contamination and develops information that supports a Conceptual Site Model in which the source is depleting more rapidly. Instead of the 4-year half-life employed in the previous analysis, let’s change the source decay rate to a two year half-life, and observe the effects. After running the model with this new degradation rate, the C v t plot shows a faster depletion of benzene overall as well as a faster concentration decline.
 |
| Figure 6. The C v t chart in TS-CHEM displaying benzene concentrations at the three set observation points. |
The contour chart shows that after 6 years, the benzene plume (with a boundary of 5 ug/L) extends about 810 feet with an area of 68,150 ft2 before receding, which is 22% smaller than the maximum plume extent in the previous analysis. By year 10, the plume boundary recedes to about 220 feet.
 |
| Figure 7. The contour chart in TS-CHEM set to year 6 highlighting its shorter plume extent compared to the previous analysis. |
The smaller plume area and quick recession of the plume may support the case for MNA at this site. Further source zone characterization may be needed to support the use of the faster degradation rate, however.
Analysis 3: Examining A Higher Source and Plume Degradation Rate
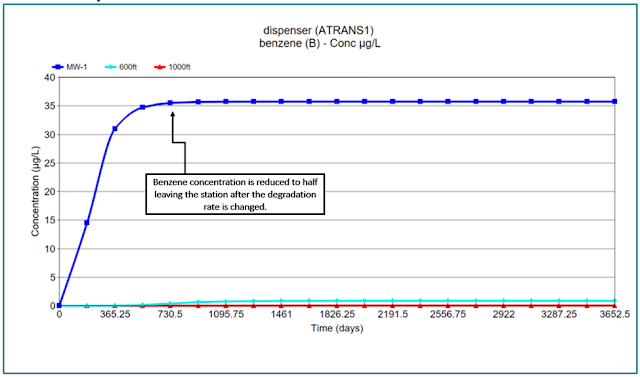
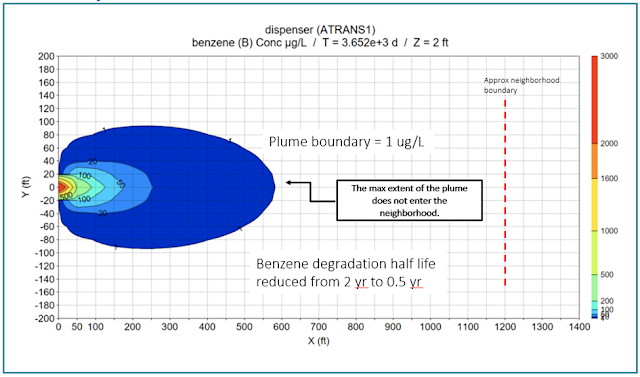
Oftentimes, regulatory agencies prescribe longer half-lives for constituents for the purposes of risk evaluations. In many cases, however, half-lives of contaminants like benzene are shorter than the default degradation rates typically prescribed by regulatory agencies. In this analysis, let’s increase the degradation rate of the plume (in addition to the increased degradation rate of the source in the last analysis) to observe the contamination extent in the case of a rapidly depleting source and plume. Instead of a 2-year half-life, let’s change the benzene degradation rate to a 0.5 year half-life.
The C v t plot shows that the maximum concentration observed at MW-1 is less than the maximum concentrations observed in the previous two analyses. Also, the plume decays before reaching the next two observation points at 600 and 1000 feet.
 |
| Figure 8. The TS-CHEM C v t chart showing benzene concentrations in the three set observation points. In this analysis, benzene isn't detected at the latter two observation points. |
The benzene plume extends to about 350 feet after 2 years before quickly shrinking in areal extent. The plume area at year 2 is 26,150 ft
2, which is 61% smaller than the maximum plume extent in the first analysis. After year 10, the plume only extends to about 110 feet due to the groundwater flushing of the source, as well as the higher degradation occurring within the plume itself.
 |
| Figure 9. A greatly reduced benzene plume seen in TS-CHEM's contour chart following the increase of plume and source degradation rates. |
This analysis - - especially using the more rapid benzene plume degradation rate - - shows that MNA could be a good potential remedial option for this site if acceptable information can be generated to support the degradation rates of the source and the plume.
Conclusion
MNA is an attractive remedial option for parties looking to reduce cleanup costs, however, it must first be demonstrated that your site is a viable candidate for MNA per state and federal guidance. This often includes using data-driven solutions to form lines of evidence as to why your site is suitable for MNA. TS-CHEM provides a simple tool to evaluate the growth and decay of a contaminant plume, which allows for the evaluation of potential impacts to receptor locations downgradient from the source in the case the source concentration decreases through time due to flushing. This type of analysis can help determine a site’s suitability for MNA as a remedy.