Friday, December 9, 2022

TS-CHEM - The Swiss-Army Knife of Solute Transport Modeling

Understanding Plume Movement at a Site

Environmental professionals are often tasked with investigating contaminated sites to understand the nature and extent of contamination in groundwater, and select an appropriate remedy that will effectively limit migration of impacted groundwater, treat it, and prevent groundwater plumes from reaching sensitive receptors.  To do this, a sound conceptual site model (CSM) is necessary, which requires not only collection of adequate site data (including groundwater sampling data, water level elevation data, and information on site hydrogeologic conditions) and application of professional judgement, but also the use of data analysis tools and techniques that allow for a better understanding of the fate and transport of contaminants in groundwater.

Plume Modeling Tools

Although there are a number of analytical solute transport modeling tools that are freely available (such as the Pennsylvania Department of Environmental Protection’s Quick Domenico Model, and the United States Environmental Protection Agency’s BIOCHLOR model), these tools are relatively simple, and while they serve as great screening level tools, they are typically limited in how they represent site source conditions (e.g., as a constant concentration “patch” source) and in how they present results (often only a simple concentration versus distance curve with no plume contour plot).  

Better Representation of the Contaminant Source

Simplified source condition models may be adequate for some site analyses  (e.g. for conservative screening analyses) but, in reality, sources of groundwater contamination are usually more complex, and may need to be represented in a different way.  Does this mean that as an environmental professional, you have to plan on additional budget for the development of a more sophisticated 3D numerical fate and transport model, or forgo any modeling analyses altogether due to budget and time constraints? The answer is no.  

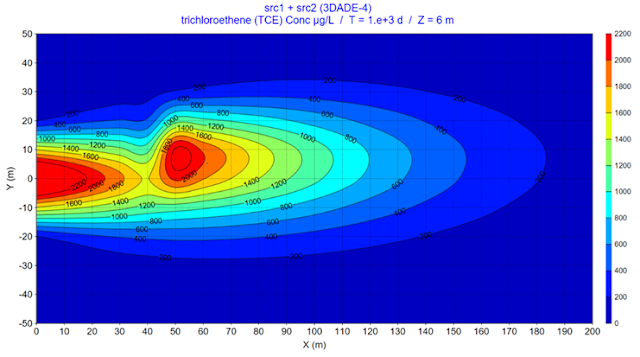
As environmental professionals ourselves who routinely conduct solute transport modeling analyses as part of our work, we wanted to develop a tool that included the many analytical solutions that have been developed over the last several decades – essentially, a “Swiss Army Knife” of solute transport modeling.  So, we developed TS-CHEM to include a library of More than 30  Analytical Solutions, each with different capabilities, including how they represent contaminant sources.  The various solutions within the TS-CHEM library are capable of representing sources as points, lines, volumes, and patches (including rectangular and circular geometries).  Additionally, source concentrations can be continuous, constant, decaying, and/or transient.  This provides a great deal of flexibility in allowing for the selection of source configurations that best represent site conditions. 


Figure 1 - TS-CHEM Source Geometry Capabilities


Better Presentation of Analysis Results

In addition to having only limited capabilities with regard to source representation, many freely available solute transport modeling tools also lack the ability to analyze and interpret modeling results – often only showing simple plots of concentrations vs. time/distance.  As environmental professionals, there are typically other information needs that arise when developing our CSMs and planning remedies. For example, what volume of water is impacted?  What is the estimated contaminated mass within the plume?  What is the mass flux through a segment of the plume?  Based on our experience in performing solute transport modeling analyses to assist with CSM development and remedy planning (and having these kinds of questions come up), we built in a whole suite of analysis tools into TS-CHEM, including tools that allow for the estimation of:

Plume area
Plume volume (including total aquifer volume, and water within aquifer materials)
Plume mass
Average plume concentration
Plume mass flux


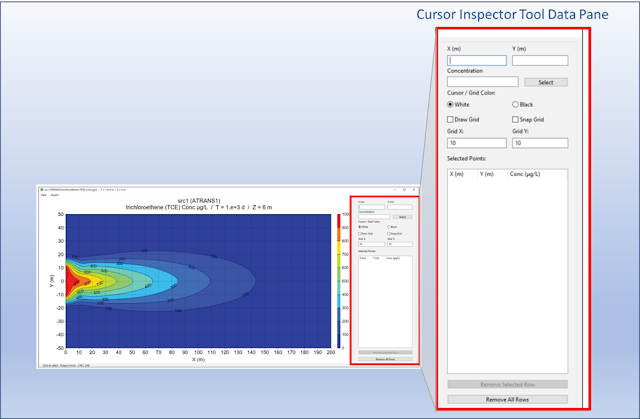
Figure 2 - TS-CHEM Plume Mass Calculator Analysis Tool

These TS-CHEM analysis tools allow environmental professionals to quickly and easily obtain key information about groundwater plume characteristics, without having to export data and analyze it in another software program (or programs) – another reason why TS-CHEM is the “Swiss Army Knife” of solute transport modeling!

To learn more about TS-CHEM, or to download a FREE DEMO VERSION of the software, visit the TS-CHEM Website today!

Wednesday, August 17, 2022

Visualize Your Modeled Plume with the New Map Overlay Feature

One of the most exciting new additions in the latest release of TS-CHEM (version 2022-2, which can be downloaded HERE) is the new “Map Overlay” feature.  After a concentration contour chart has been created and displayed, the TS-CHEM Map Overlay tool can be used to visualize the calculated plume. The plume is displayed as an overlay on a digital map, with the source located at the user-entered address. Attributes of the map and the plume can be modified using various Map Overlay controls.

Using the new Map Overlay is simple.  Once you have generated a concentration contour chart and adjusted the plume contours to your preferred bounds, simply click on the “Map Overlay” button just above the plume contour chart (see Figure 1).


Figure 1 - Plume Contour Chart

A popup will appear that allows you to enter an address, and then click “Go”.  For example, entering “Statue of Liberty NY” will display your contoured plume with its origin at the Statue of Liberty (as shown in Figure 2 below).


Figure 2 – Example Map Overlay with Plume Contour Chart Originating at Statue of Liberty


Once your contour plot is overlayed on your site of interest, you can use the “Map”, “Plume”, “Overlay”, and “Metrics” tabs within the Map Overlay window to modify and customize your overlay as desired.  Specifically, these tabs can be used to do the following

  • Change the desired map style (e.g., satellite) zoom in or out, and access the plume and legend formatting controls (Map tab)
  • Modify plume origin, rotate your plume, adjust plume transparency, and display model grid extent if desired (Plume tab)
  • Modify the many features of the overlay map image, including Title, Legend, Scale (Overlay tab)
  • Examine information related to the map location (latitude and longitude), current zoom level, etc. (Metrics tab)

Figure 3 – Customized Map Overlay ready for export

Once you have adjusted and customized your map to your liking, simply click the “Save Image” button, in the lower right corner of any of the Map Overlay tabs, which allows you to export the Map Overlay image as a .PNG or .JPEG (.JPG) file (which can then be used to incorporate into a report figure, slide deck, etc.)

In addition to the new Map Overlay feature, several other updates and improvements have been incorporated into TS-CHEM version 2022-2, including:
  • The addition of data charting to the Concentration Inspector tool
  • The addition of Output Times information to the Solve window (to indicate when requested output may require long solve times)
  • Enhanced solve speeds for several codes, including ATRANS (1, 2, 3, and 4), BIOSCREEN-AT, and AT123D-AT
  • Enhanced speeds for contour chart drawing and project save files
  • Minor bug fixes

To take advantage of these updates and improvements and test out the new Map Overlay feature, head over to the TS-CHEM Website to download version 2022-2 today! 


Sunday, June 5, 2022

TS-CHEM Version 2022-1 Now Available!

We are pleased to announce the release of TS-CHEM version 2022-1!  Key updates in this new version include the following:

  • Easier data entry controls
  • The addition of a concentration cursor inspector tool to allow for examination of concentrations at points of interest within the modeled plume (which can be copied to a data pane and then and then be exported for analysis using other software (e.g., Microsoft Word or Excel))
  • Labeling of concentration contours on plume contour charts
  • Minor bug fixes
Figure 1: Labeling of Concentration Contours

Figure 2 – Concentration Cursor Inspector Tool Data Pane


Concentration contour labels can be displayed or hidden, and their font type, size, and color are user selectable.

New data controls were designed to prevent inadvertent entry of extraneous spaces or item separators that in some cases interfered with the proper calculation and display of model results.

In addition, the new Concentration Inspector tool provides the user with a way of analyzing calculated plume concentrations. Concentration values on any selected output plane can be mapped and inspected using the cursor to examine concentration trends in the plume. X, Y, Z, C data at selected locations can be saved to the inspector list, and then exported for cross-section plotting in Excel of other graphic software.

Visit the Transport Studio Website today to download the latest version of TS-CHEM!