
New Features in TS-CHEM v2023-1
We are proud to announce the release of TS-CHEM version 2023-1! There are a host of new features, with key updates including:
- A new color spectrum control for contour charts
- The addition of a plume boundary specification with contour plots using the log scale
- Refined unit conversion factors for model setup parameters
- An enforced QA check on the model data’s save and reload process
- Minor bug fixes
The new changes to contour plots allow for more flexibility
than ever when visualizing your modeled plume! A brief overview of these new
features is included below.
A COLORFUL (HALF-) LIFE
Contour plots in TS-CHEM just got more colorful! In v2023-1 a color spectrum control has been added for contour charts. This allows the user to fine-tune their color scale with up to five colored contour intervals!

In addition to allowing for custom-colored contour intervals, if the user wants to define their concentrations as “high” or “low”, just adjust the Gradient Style to Two Colors and refine the plot.

The new version of TS-CHEM can even represent a single color
in style! With the One Color Transparency option the concentrations
become more transparent the lower they get, emphasizing where the high concentrations
occur in your plume.
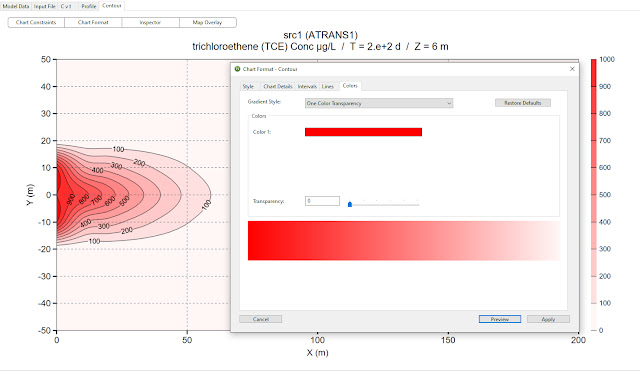
Transparency is not just limited to the one-color setting,
either! As seen in the figures above, uniform transparency can be applied to
the contour plots using any of the color spectrums the user defines. This can
be especially useful when combined with the Map Overlay feature!
PUT A
LIMIT ON YOUR LOG PLOTS
The logarithmic scale (“log” scale) is an important and
useful tool when visualizing contaminant plume data. It allows for large
differences in concentration to be expressed in an understandable way. For
instance, here is a contour plot of a contaminant plume with a linear scale:

We can see that our concentrations go from 100 – 1000 ug/L,
with contours every 100 feet. What if we wanted to see what was going on with
the lower concentrations less than 100 ug/L? We can either add a lot more
contours or use a logarithmic scale:
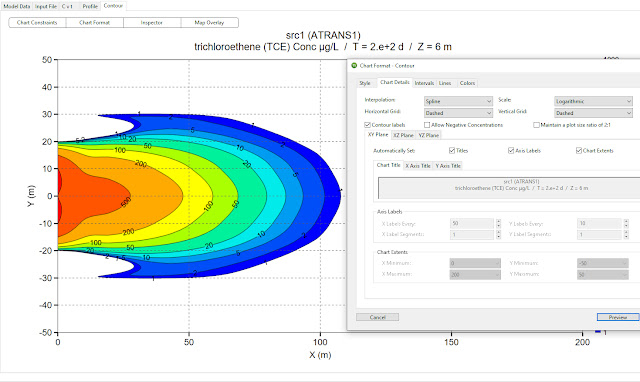
We can now easily see our concentrations ranging from 1 to
1000 ug/L with only 10 contour lines. And, in TS-CHEM v2023-1, we can now add a
boundary to this log scale plot. For example, we are interested in what the
plume looks like between 10 and 1000 ug/L. We can set a plume boundary equal to
10 ug/L and update our plot to reflect this new data range:
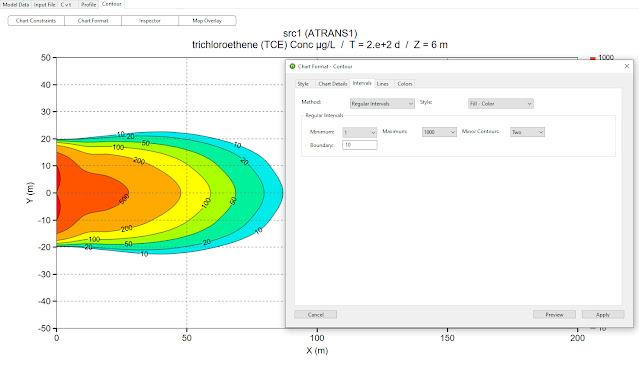
These new contour plot controls provide additional tools that
can assist the user in producing customized report- or presentation-ready
graphics from your TS-CHEM plume transport modeling analyses.
To learn more about the new features of TS-CHEM v2023-1, or to download a FREE DEMO VERSION of the software, visit the TS-CHEM Website today!
No comments:
Post a Comment