TS-CHEM v2022-3 has some great new features, including new options for BIOSCREEN-AT, Dark Mode (Mac version) and the ability to double-click project files to open them. But some of the most powerful features center around the new chart controls. A brief overview of these new chart controls is included below.
CHART AXIS CONTROLS
All three of the major chart types (C v t, Profile, and Contour) display axes; and so does the digitized concentration chart in the Concentration Inspector tool. In TS-CHEM v2022-3, the user can now control almost every aspect of the of these chart axes including:
- Major tick and label placement
- Minor tick spacing
- Chart grid lines
- Custom axis title
- Axis extent
 |
Figure 1 - TS-CHEM Chart Axis Controls |
These controls allow for the creation of better-looking data plots.
 |
| Figure 2 - TS-CHEM Concentration vs. Time Data Plot |
And, in the case of the axis extent controls, they allow the user to zoom in on a portion of the chart to better examine data concentrations or trends.
 |
| Figure 3 - Zoom-in of TS-CHEM Data Plot |
CONTOUR CHART CONTOLS
Contour charts now have a second set of controls (in addition to the axis controls) that allow easy formatting of the contour intervals and the type of contour chart used to display the data.
Intervals controls allow the user to accept the automatic TS-CHEM contouring, or specify Regular Intervals (min, max, and interval), or select Custom Contours to customize the spacing and color of the contour display.
 |
Figure 4 - TS-CHEM Contour Charts - Custom Settings |
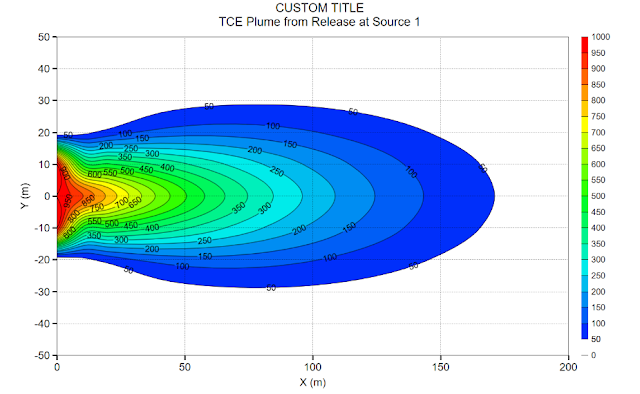
The value specified in the Boundary field (50 in the example above) serves as a plume cutoff concentration, and the plume image is transparent for concentrations below the Boundary value (see below). This makes it very easy to create a bounded plume to place on digital map using the Map Overlay feature.
 |
Figure 5 - TCE Plume Contour Chart - Plume Bounded at 50 ppb |
Additionally, the Style for a contour chart can be selected from a dropdown menu containing the following options:
- Fill – Color
- Fill – Grayscale
- Lines Only – Color
- Lines Only – Grayscale
- Lines Only – Black
An example of a Lines Only – Color contour chart is shown below.
 |
Figure 6 - TCE Plume Contour Chart Displaying Lines Only - Plume Bounded at 50 ppb |
These sets of controls, tailored to each of the different chart types, provide the tools needed to produce report- or presentation-ready graphics from your TS-CHEM plume transport modeling analyses.


No comments:
Post a Comment